
See what's working while it's happening.
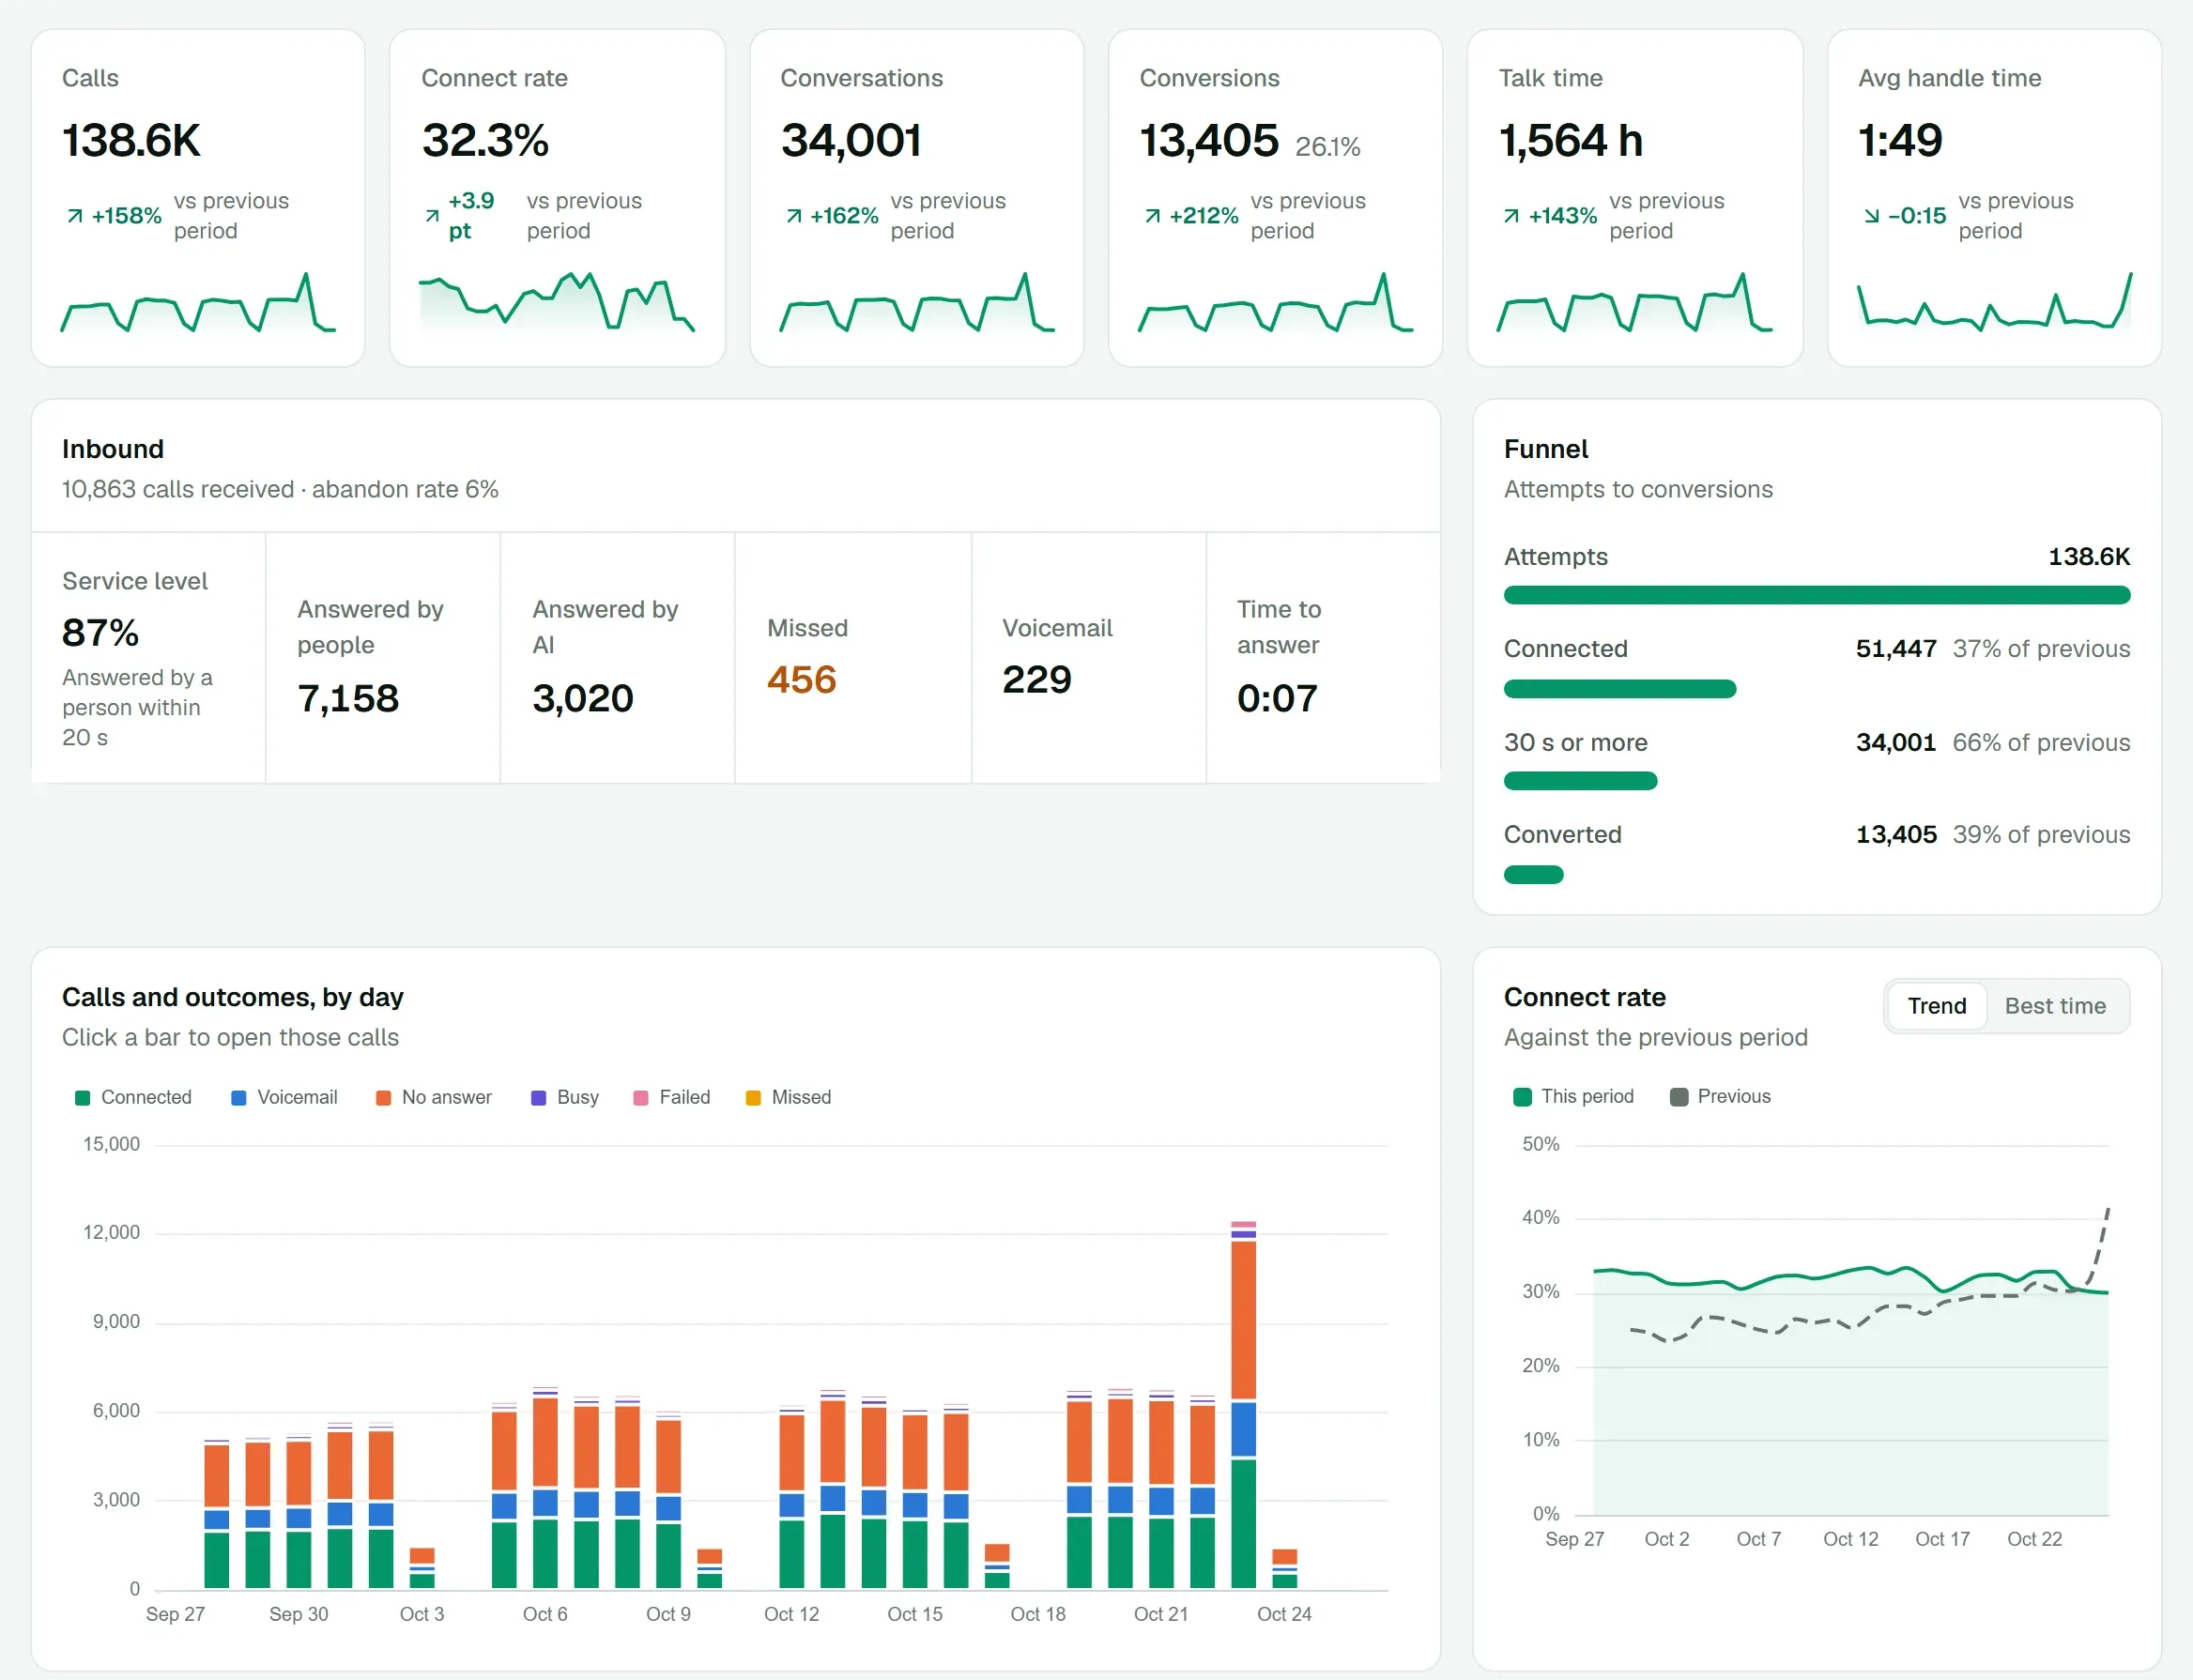
Connect rate, conversations, conversions, talk time and service level, compared with the previous period and broken down by campaign, caller ID, carrier, person and AI agent. Figures update live, and every chart opens the calls behind it.
- 01
Every figure against the previous period
- 02
By campaign, caller ID, carrier, person and AI agent
- 03
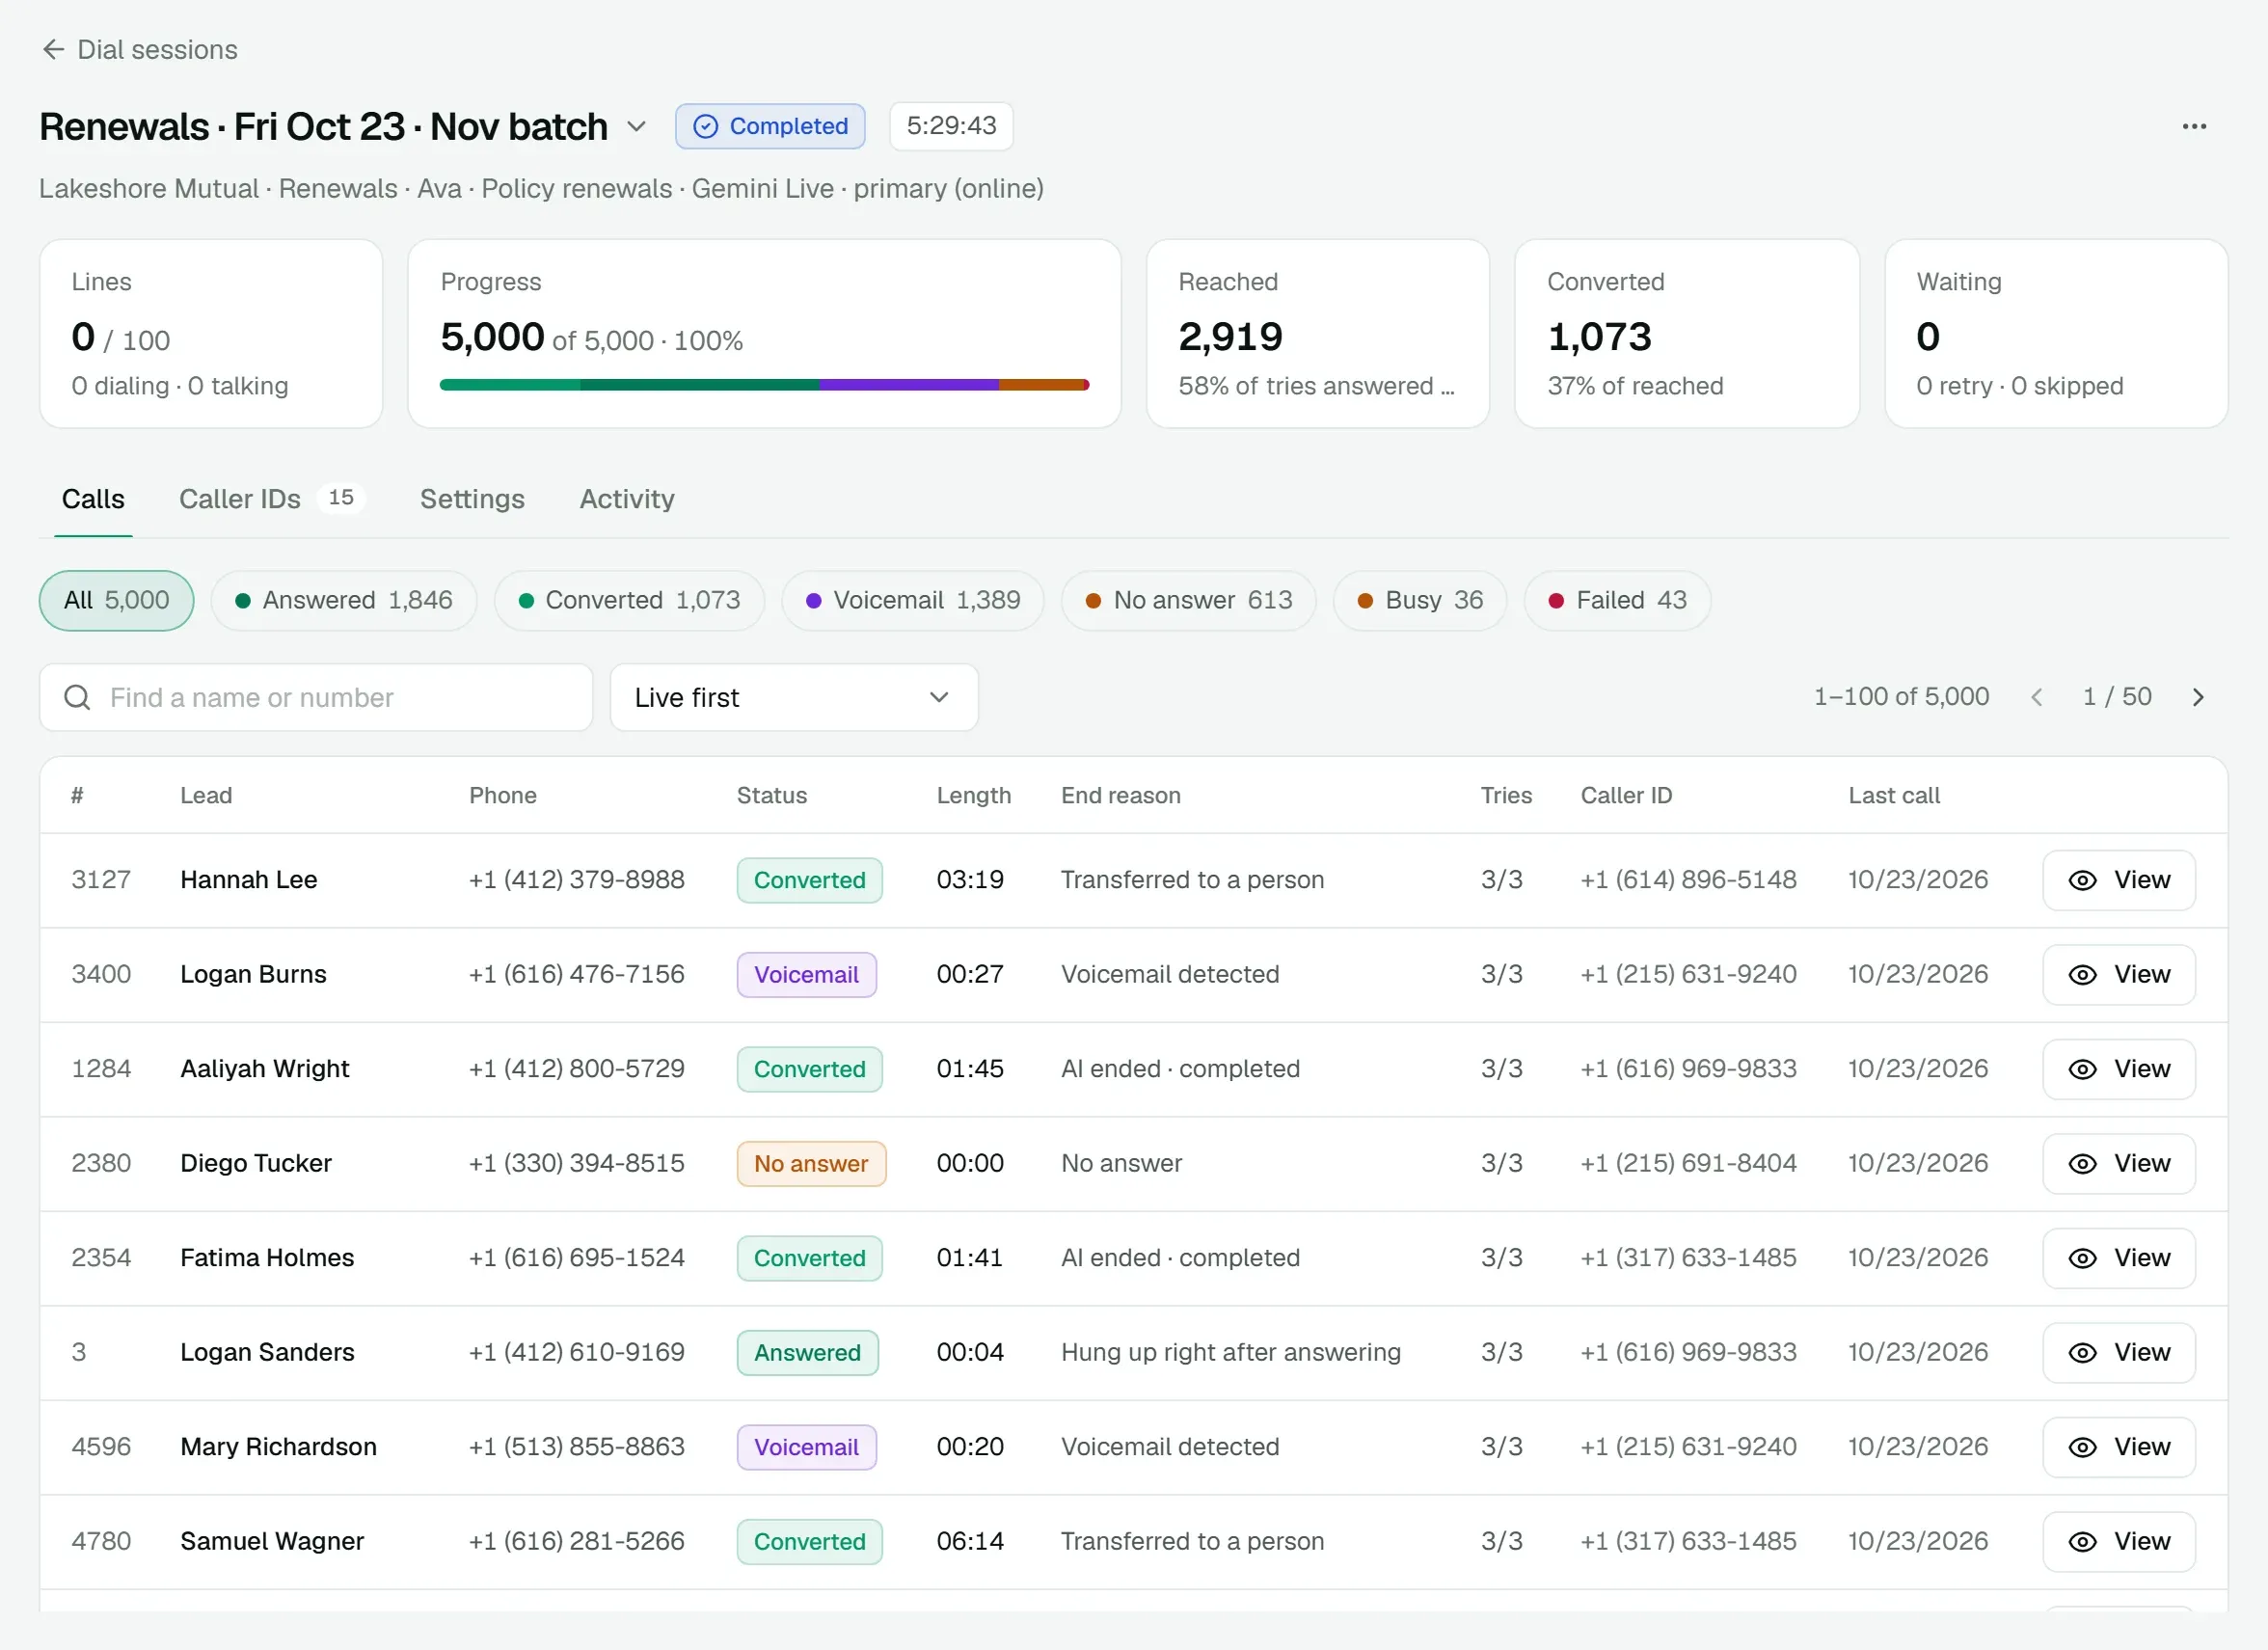
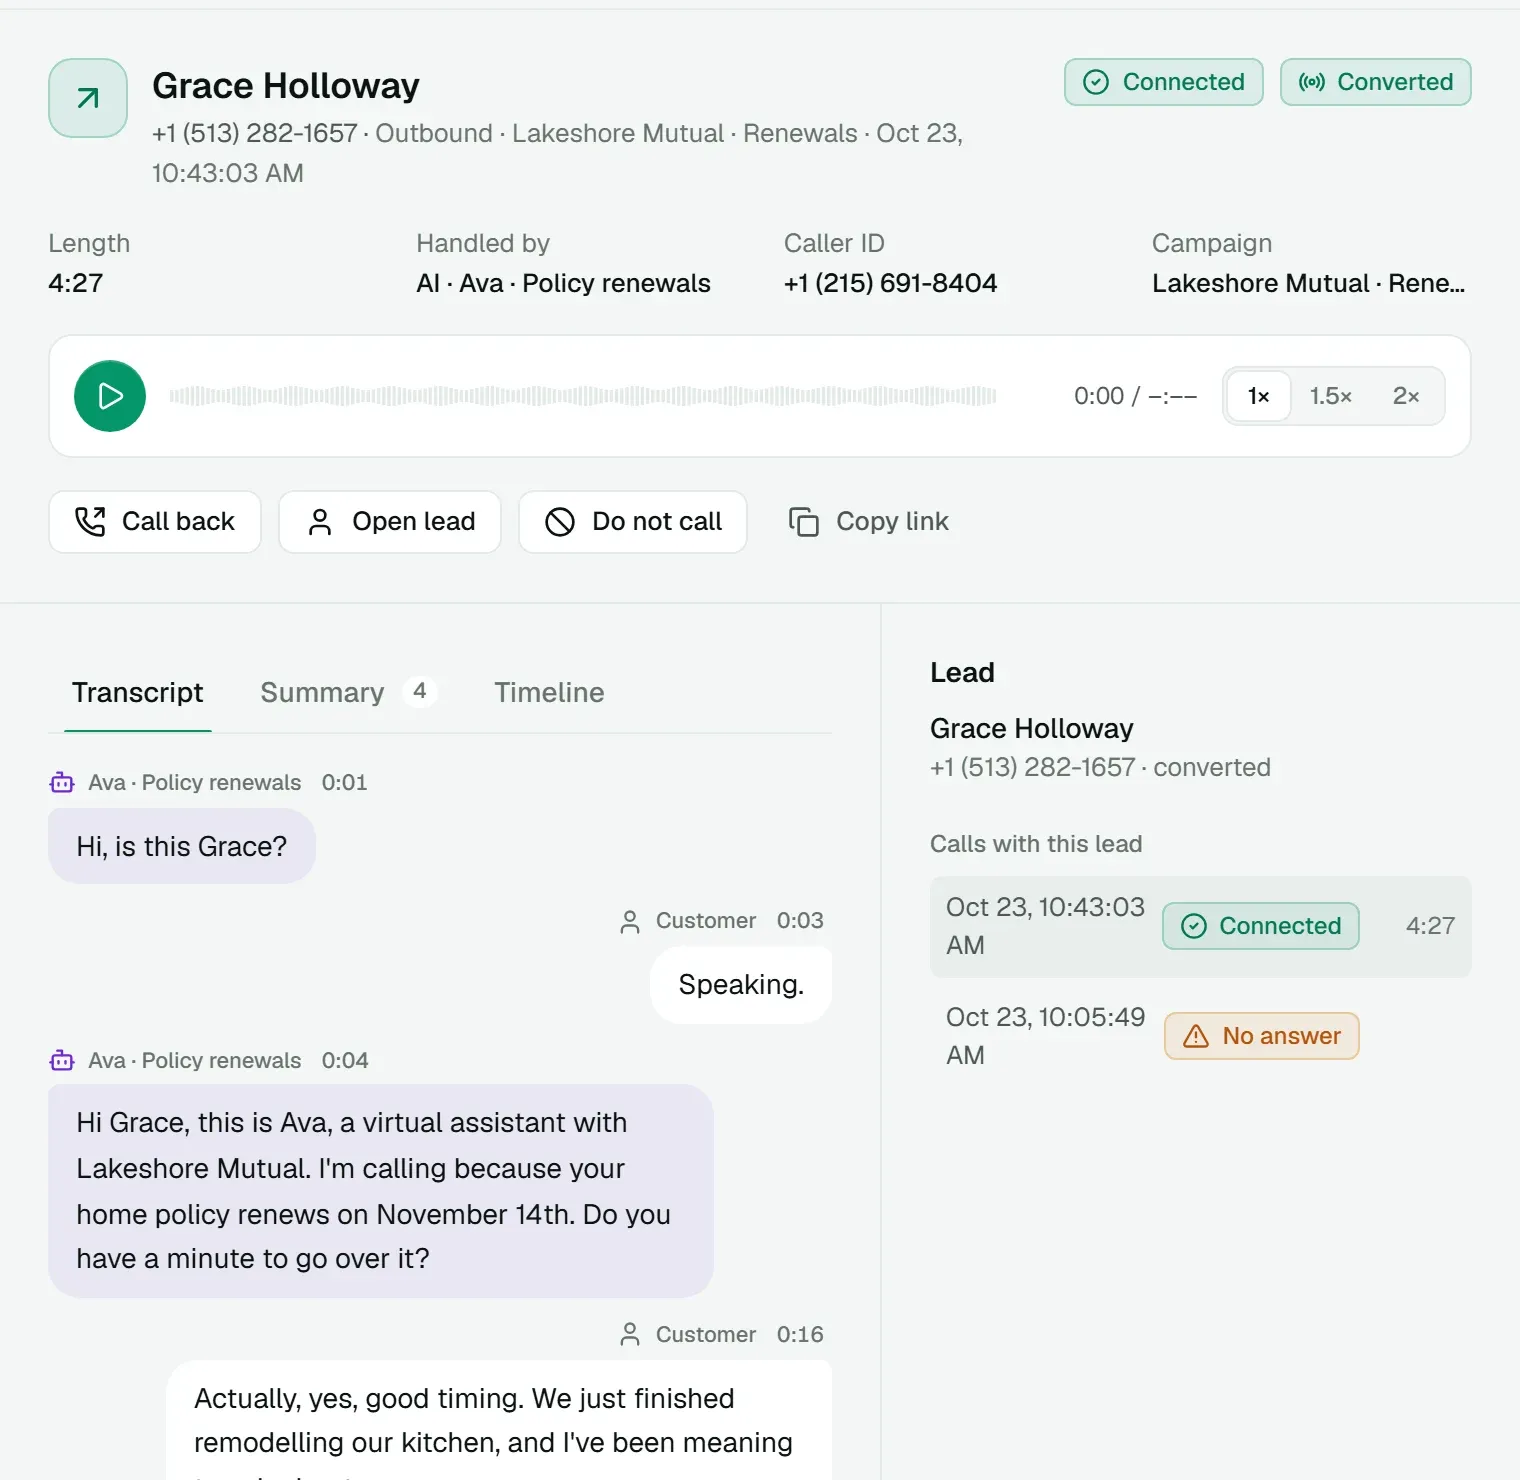
Click any bar to open the calls behind it
01
Calls and outcomes by day
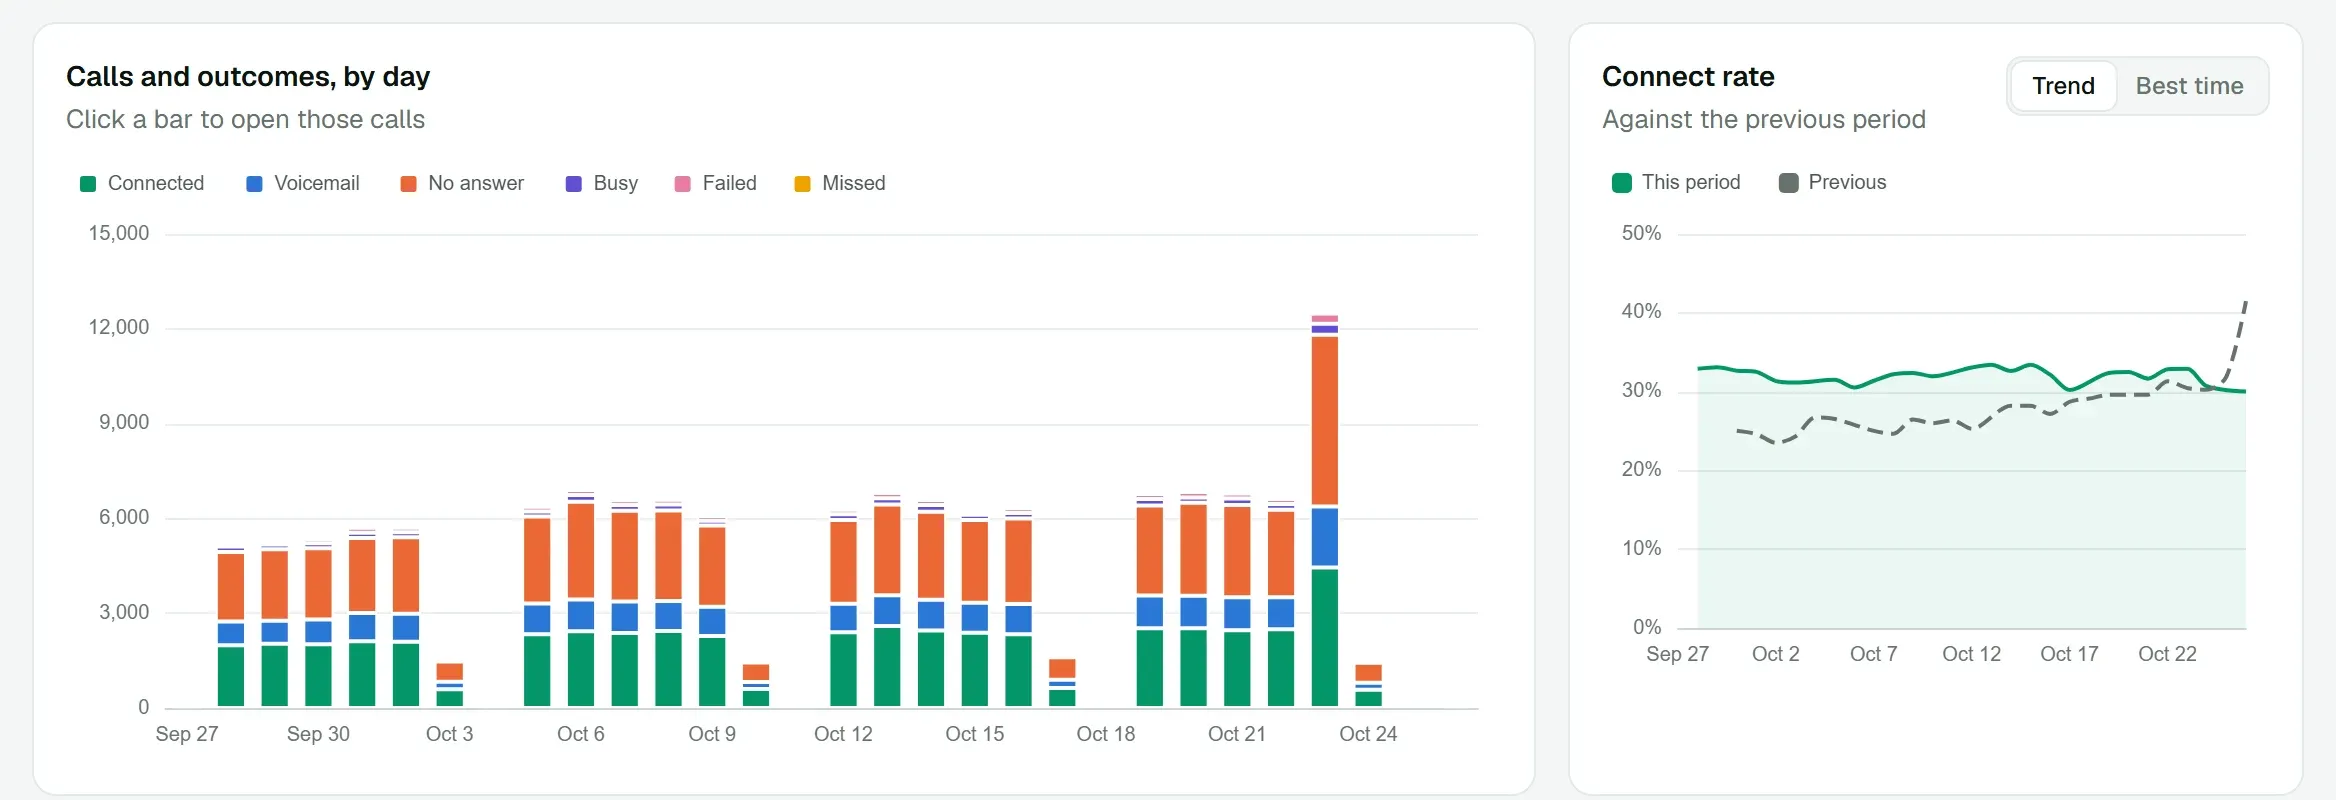
Connected, voicemail, no answer, busy, failed and missed calls for each day. Click a bar to open those calls. Next to it, the connect rate trend against the previous period, and the best time of day to call.
02
Breakdowns that point at the fix
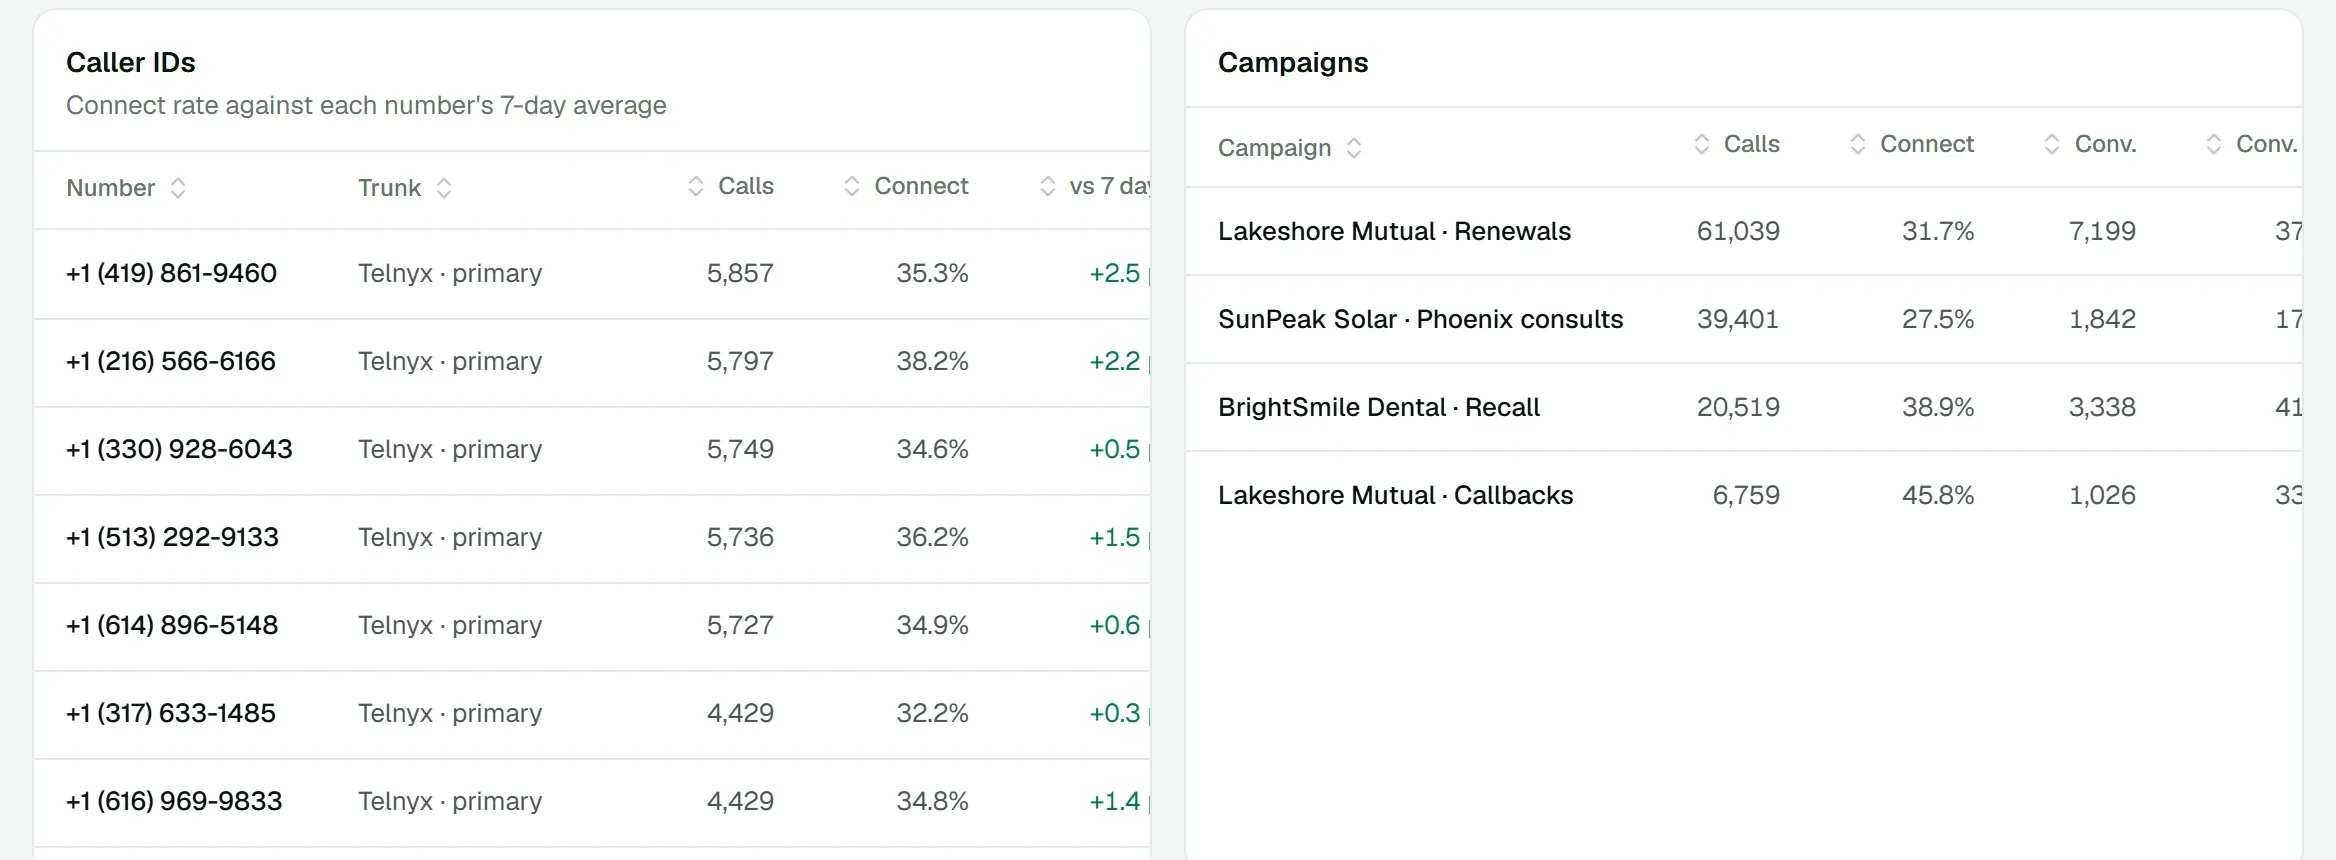
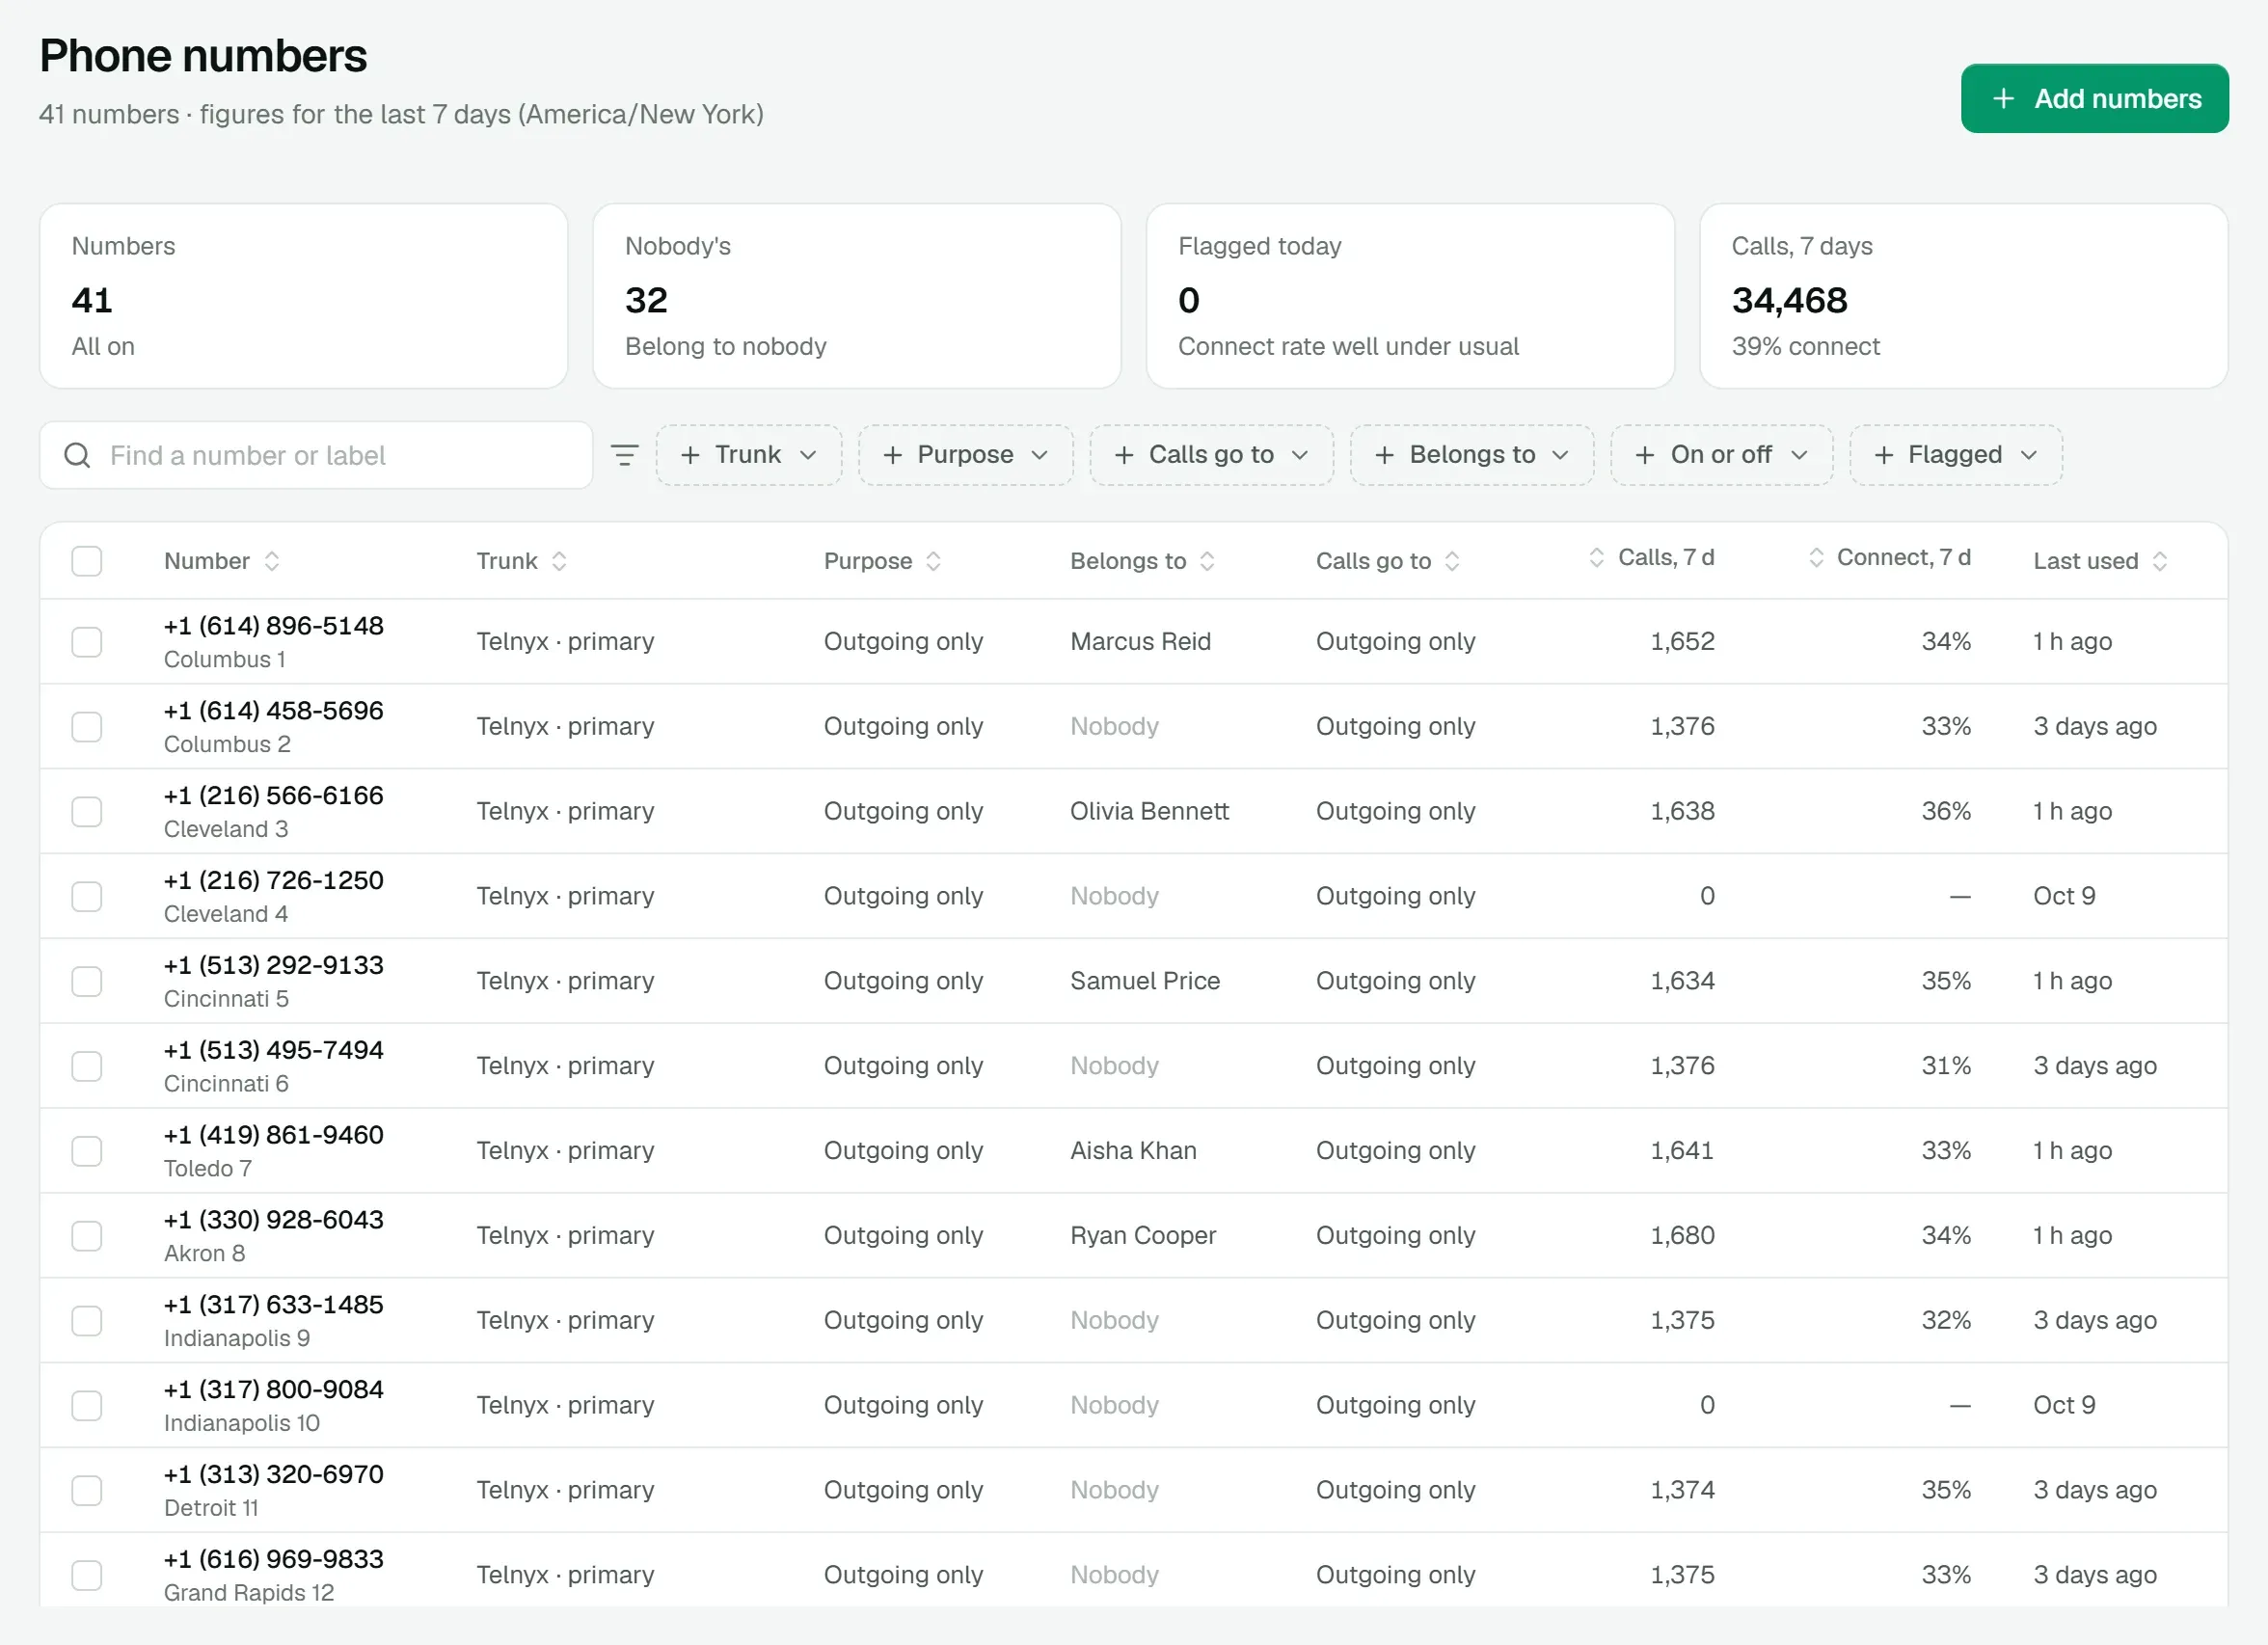
Caller IDs ranked by connect rate against their own 7-day average. Campaigns with calls, connect rate and conversions. Carriers with their failure rate and the most common cause.
03
Every AI agent, side by side
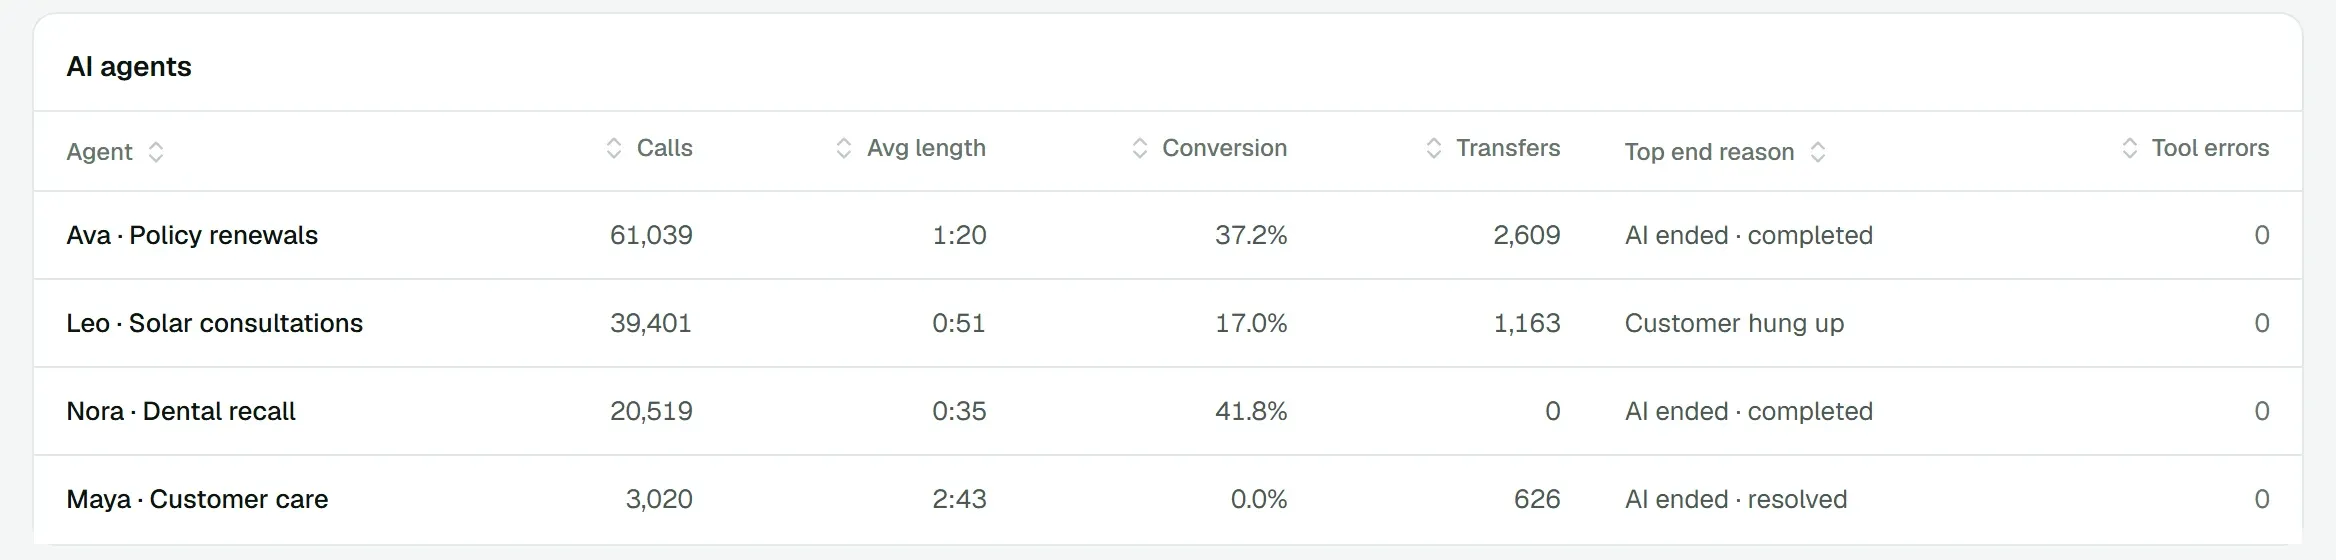
Calls, average length, conversion, transfers, the most common reason calls ended, and tool errors for each AI agent.
04
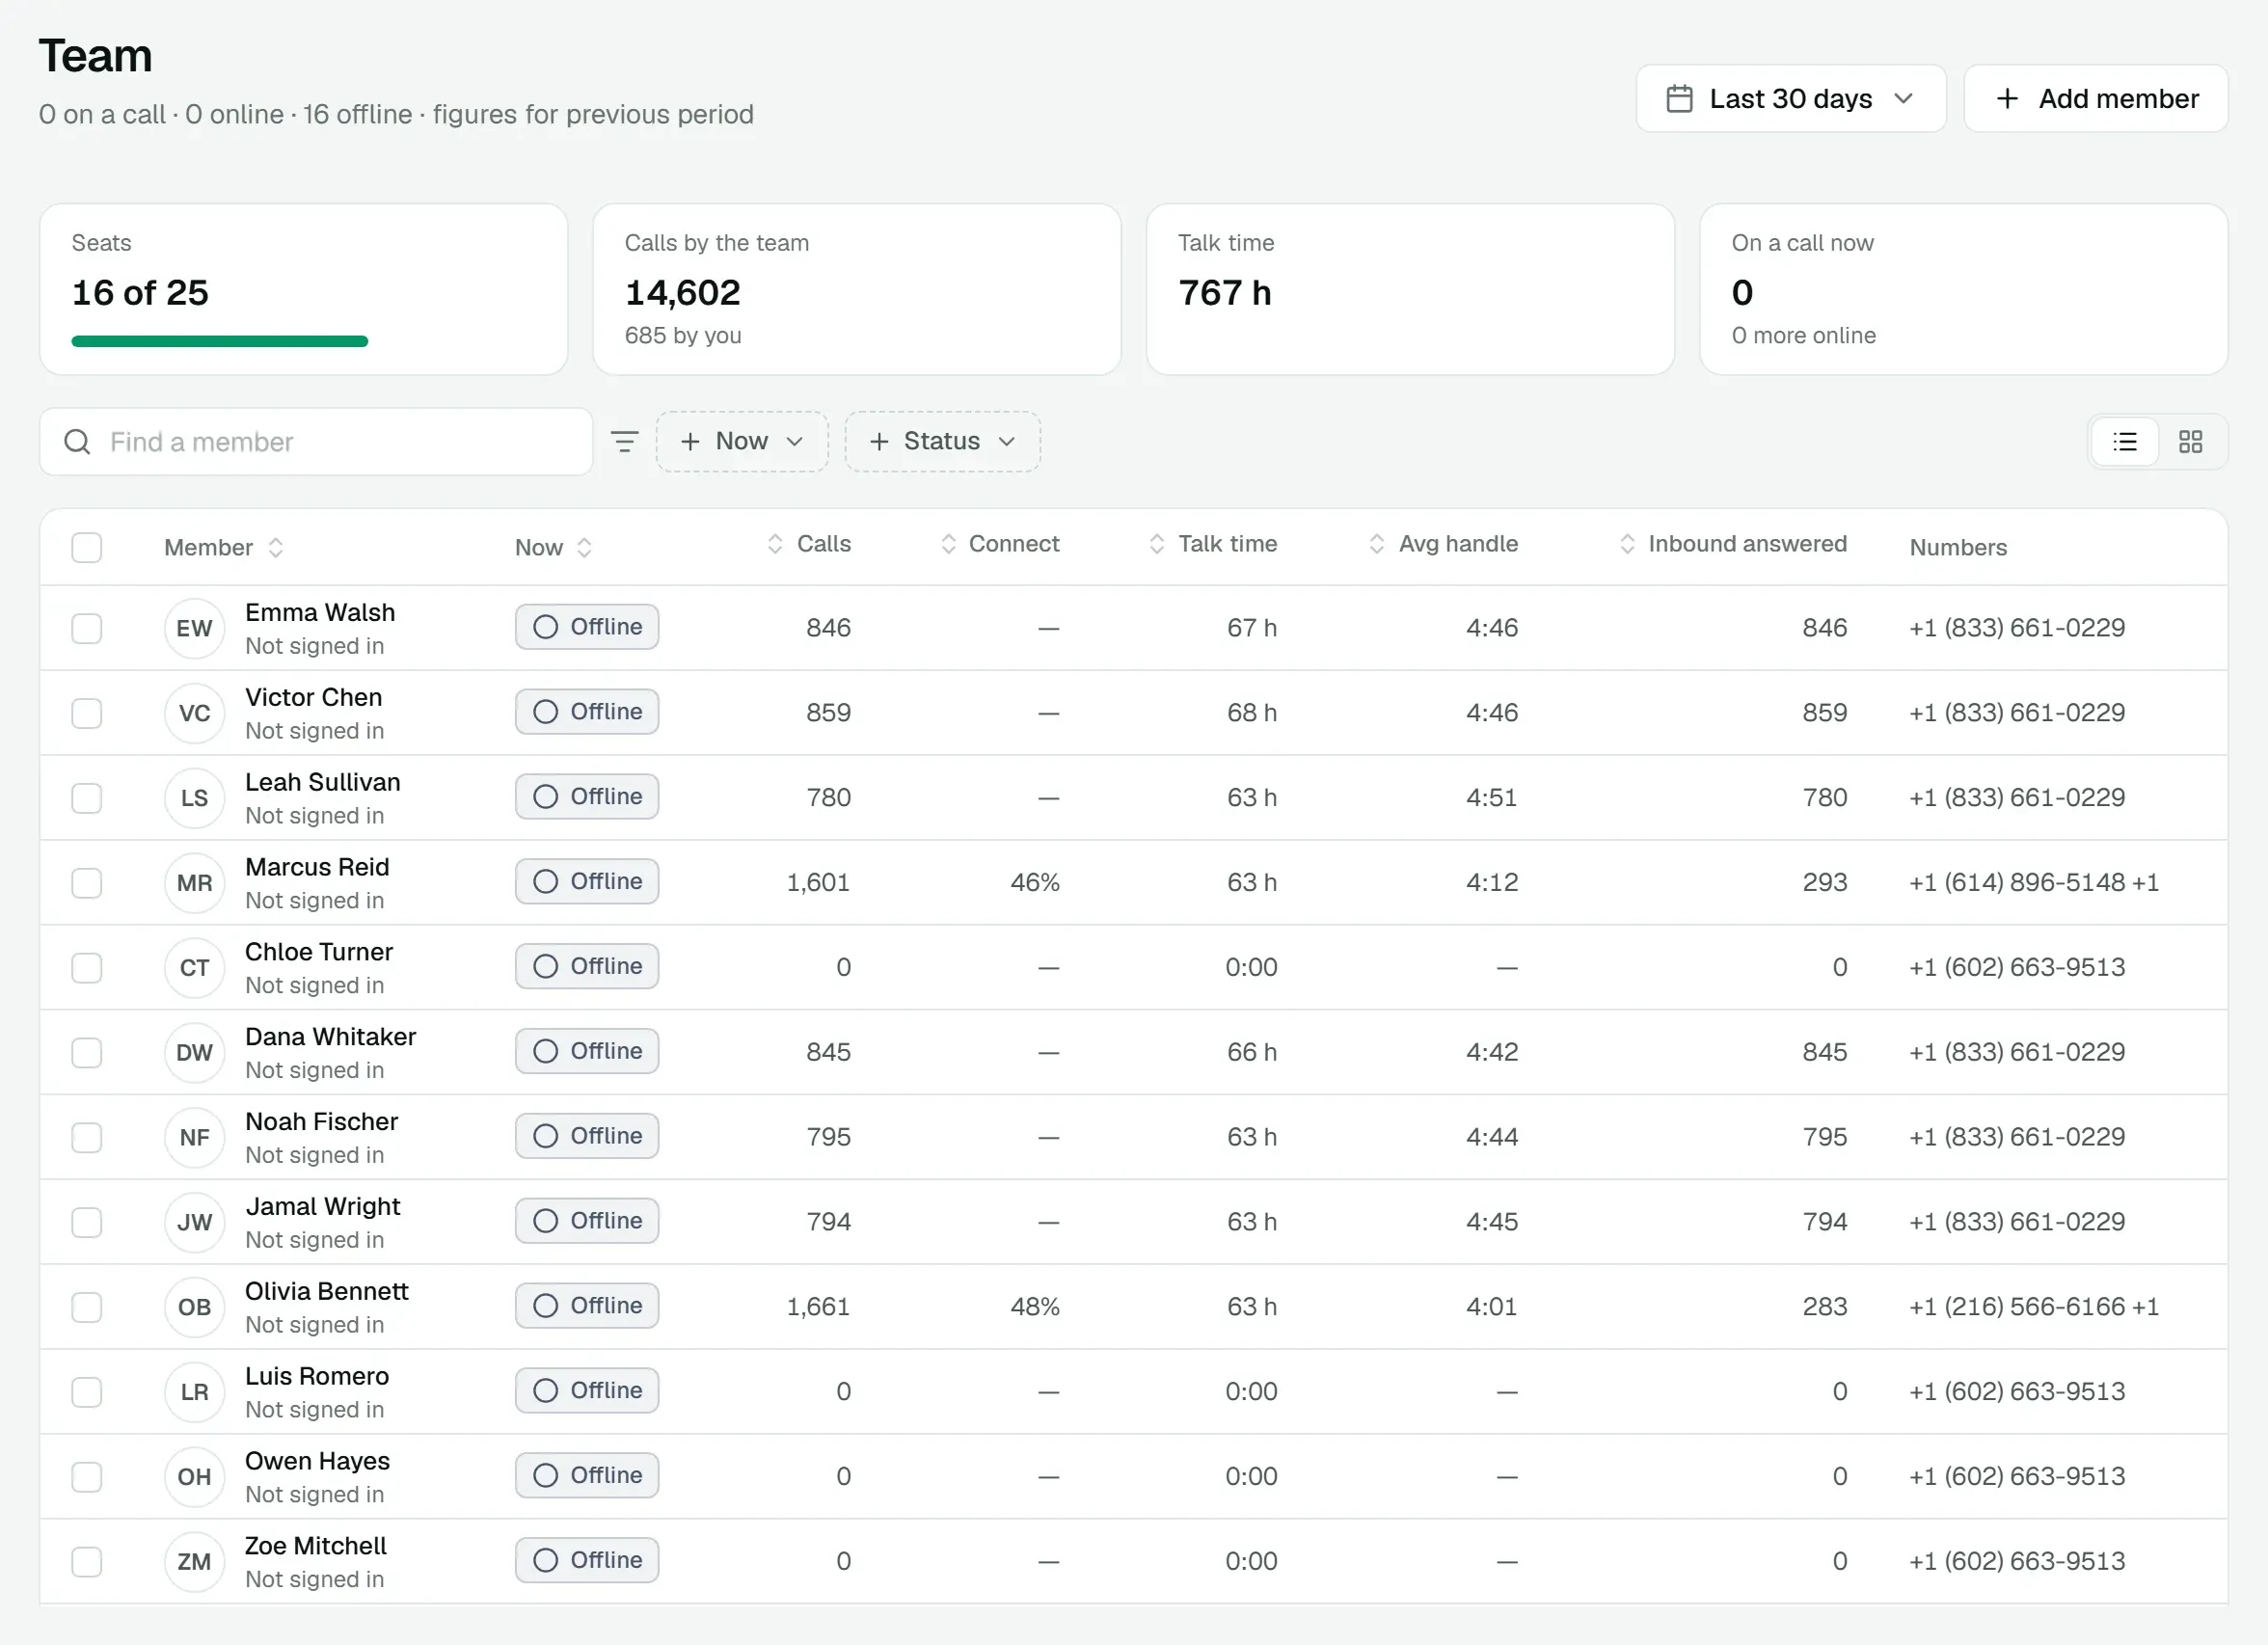
Your team, person by person
Seats in use, calls placed and taken, connect rate, talk time, handle time and inbound calls answered. Open anyone for their calls by day, numbers, access and sign-ins.
Everything in Analytics
Included in the platform fee, like every other product. No charge per agent, per minute or per text.
How pricing works- Live
- Calls in progress, session lines in use, people online and AI runtime health.
- Any range
- Today, yesterday, 7 or 30 days, month to date or custom, in your time zone.
- Previous period
- Every figure compared with the period before.
- Click through
- Open the calls behind any bar or row.
- Funnel
- Attempts, connected, 30 seconds or more, converted.
- Inbound
- Service level, answered by people and AI, missed, voicemail, time to answer.
- Per person
- A page for each team member, and My stats for agents.
- Carriers
- Outbound failure rate and top cause per trunk.
See it on a call of your own.
We'll walk you through the dialer, a live AI call and AI Messenger, then quote the platform for your floor.